
October 2022 - Snohomish County Real Estate Housing Data
- Joe Frank

- Nov 5, 2022
- 9 min read
Updated: Nov 18, 2022
The following data and charts represent monthly data from January 2019 to October 2022. The analysis is focused mainly on trends from April 2022 to the current month.
In previous months I was looking back to only January 2021, however if we look back further to more "normal" and housing-market-healthy-time (pre-Covid), it can provide a broader perspective on the state of the current market, and that it actually might not be so bad (and perhaps trending back toward a more healthy and balanced market).
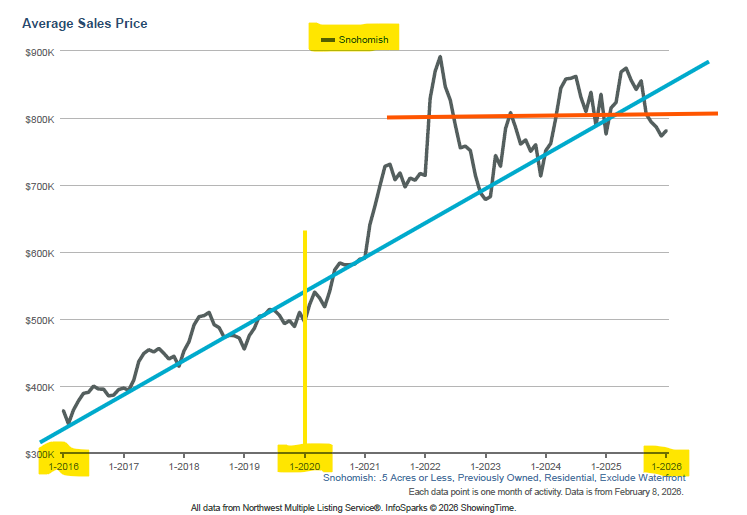
1. Average Sales Price
In Snohomish County the Average Sale Price hit a peak in April 2022 ($882,000). In May of 2022 the average home sale prices reflected a decline of 5% ($839,000). The June average sales price declined 7% from the April high to an average sales price of $818,000. The trend continued as expected for July 2022 with an average sales price of $780,000 which was 11.5% below the April high. The September 2022 average sales price ticked up slightly from August ($746,000, adjusted) to $749,000. For October, the downward trend once again continues with an average sales price of $742,000. This can be attributed to continued rising interest rates and seasonality.
I would expect the downward home price trend to continue as homes are still unaffordable for the average worker / salary. This housing market here in Snohomish County (and beyond) is still adjusting and trying to find a balance between home buyers and sellers.
There are interesting market dynamics at play. The Fed is stating they are still concerned with inflation, thus will continue to adjust the Fed funds rate into 2023. This is driving up mortgage rates which in turn is slowing down the housing market due to sellers not listing (since most need a replacement house, which will require a higher mortgage rate, and likely monthly payment) and many buyers are being priced out of the market (approximately 75% of buyers need a mortgage to buy a home). Here's a good article from Bankrate.com on the relationship between the Fed raising interest rates and rising mortgage rates (hint: it's not a direct correlation).
2. Average Days on Market
This is a telling metric to watch in gauging a current housing market. It indicates how many days a house is listed for sale (“on the market”) before an offer is accepted. When Days on Market increases, it indicates home buying demand is softening. This in turn may result in less offers, more buyer contingencies, increased supply, and ultimately, decreasing home prices.
Looking back to January 2019, Average Days on Market was over 40. This was considered to be a healthier and more balanced market. If you're looking to buy, you should be rooting for the below trend to sustain between 30 and 40.
3. Quantity of Homes For Sale (in MLS)
This metric indicates how many homes are listed for sale within the MLS. It’s also referred to as housing inventory or supply. You can see from the chart that as of approximately May 2022, the number of homes for sale has dramatically increased from last year. The acceleration coincides with mortgage rate increases (see chart 8).
As of August 2022 there are 1,000 homes listed for sale, a decrease from July's peak of 1,200. For the current month, October, we've trended down to 880, which is back in line with fall of 2019 (again, a more balanced market).
4. New Listings
The New Listings data can help shed light on the health of our local housing market and if we're trending toward a more healthy and balanced market relative to housing inventory / supply.
New listings is also influenced by the time of year - the peak season to list a home for sale is generally from about April to July. Below for October, we're seeing a continued downward trend. This is seasonality at play, but coupled with "mortgage rate lock-in effect".
Another factor to consider, and that is likely influencing the New Listings downward trend (in addition to seasonality) - if you're a home seller, and you don't need to sell your home, is this the type of market you would want to sell in? People who are selling likely need to buy another home, and with total housing/ownership costs (when financing with a mortgage) extremely high (historically speaking), many potential sellers are probably waiting on the sidelines until at least next spring to see what mortgage rates do, and in turn, home prices do (this is also called the mortgage rate lock-in effect)
From a personal perspective, we're considering adding onto our home because it would be too expensive to purchase a new home that meets our needs due to the high interest rates (we were able to refinance in 2021 at 3%).
5. Average Percent of Last List Price
This chart indicates the final sales price of a home over or under the last list price on the MLS. As you can see, Snohomish County hit a peak in March of this year at 115% (on average, in Snohomish County, homes were selling for 15% above the listed price). Example: A home was listed for sale at $700,000 and sold for $805,000.
We are now on a downward trend which is indicative of higher mortgage rates and a larger number of homes for sale (increased supply) which causes homes to sit on the market longer.
For August 2022, on average homes are selling for under list price at 96.4%, September at 95.5%, and now in October that downward trend continues at 95.4%. This is the lowest we've been since at least January 2019. Remember, home prices are still considerably higher than they were in 2019, so this is just another indication of our housing affordability dilemma - with the high mortgage rates and still historically high home prices, the average person or family will need mortgage rates and/or home prices to fall further.
6. Average Shows per Listing
The average number of people physically visiting homes for sale. The numbers are down dramatically from the highs of 2020, 2021 and early 2022.
For September, showings were up slightly from June and July 2022 (average of 6) to 7 showings per listing, but for October we've dipped back down to 6 showings on average.
This data illustrates that buyer interest has waned due to home affordability. I mean why go look if you can't afford the home or to move?
Further house showing data details for all regions of US available here from ShowingTime.com
7. Percent of Active Listings with Price Drops (Redfin.com)
This chart from Redfin shows the percent of active for sale listings that have incurred price reductions. Price drops happen when a home doesn’t get offers as quickly as expected or needed, and the home owner and Real Estate Agent review the market and seller’s situation to determine if the best option is to reduce the home’s price.
Price drops have been up and down over the last several months. Through the end of September 2022 for all current homes listed for sale, 11% have had price reductions (this is down from 13% for July). As of the end of October, prices cuts have ticked up to 12.1%.
8. Housing Affordability - Snohomish County
Housing Affordability has been decreasing since the start of 2021. Affordability has worsened recently due to continued high home prices coupled with mortgage interest rates that have doubled from the lows in 2020 and 2021.
The Housing Affordability Index (HAI) is updated quarterly and uses three key variables:
Median Home Prices
Median Household Income
Mortgage payment Cost (and assumes a 20% down payment).
Per the AWB Institute, the HAI is calculated by the Washington Center for Real Estate Research (WCRER) at the University of Washington. The HAI helps illustrate the ability (or inability) of middle-income households to make a mortgage payment on a median priced home.
"Affordable" in the space of this index equates to a household not paying more that 25% of their income toward the mortgage (principal and interest only).
A Housing Affordability Index of 100 is considered "affordable" (and a mortgage payment is exactly 25% of income). Below 100 is considered less affordable (or not affordable as you sink toward 0). Above 100 is considered more affordable.
As can be seen from below, we are on a steep downward trend of worsening affordability. This is not just a local issue, but a state, national, and even worldwide problem.

Last Updated June 2022. Source: AWB Institute
As a side note, and perhaps to put things in perspective (and make you feel a bit better about the current lack of affordable housing here in Snohomish County), the United States is actually considered affordable when compared to other major metros within eight different nations.
Most Affordable Housing Markets: Pittsburgh, PA Oklahoma City, OK Rochester, NY Edmonton, Canada St. Louis, MO | Least Affordable Housing Markets: Hong Kong, China Sydney, Australia Vancouver, Canada San Jose, CA (US) Melbourne, Australia |
Source: News Nation
9. Mortgage Rates
Mortgage rates have risen aggressively since the end of 2021 (and even looking back to January 2019). This has significantly affected home affordability due to low housing supply and home prices that remain high, coupled with these rising mortgage rates.
The following trend chart from Mortgage News Daily shows the 30 year fixed mortgage rate from January 2019 (I was only looking back one year) to early November 2022.
Elevated rates have been bouncing around the last several months hitting a recent high of about 7.35% October 20th. These 7% rates are the highest in 20 years! Home affordability continues to erode for the average home buyer who needs financing.
It's not known at this point when rates will trend back down to 3 or 4 percent (5% actually sounds pretty good now!). Much will depend on inflation and the Fed's action to battle it with the Federal Funds Rate and how the bond and mortgage markets respond.
Higher mortgage interest rates directly affect home affordability and therefore the housing supply and prices - no doubt a very important metric to keep an eye on if looking to buy, sell, or refinance.

Source: Mortgage News Daily
To gain a broader sense on the health of our local housing market and economy I'm sharing unemployment data along with new single family home construction permits . These data points can show signals and trends on the health of the economy, and ultimately the housing market.
Unemployment
This data is provided monthly by the Washington State Employment Security Department, and has a two month lag. There is no monthly trend data that I can locate for strictly Snohomish County, so I plan to track and create a trend chart that will be maintained in this blog.
From April 2022, each month the unemployment rate has been slowly increasing. According to the Fed, they'd like to see the national unemployment rate to be at least 4%, as they feel this will help to slow the economy and begin curbing inflation.
As of September 2022, Snohomish County Unemployment was at 3.3%
August 2022 = 3.4%, July 2022 = 3.3%, June 2022 = 3.1%, May 2022 = 2.9%, April 2022 = 2.3%)
Source: esd.wa.gov
New Residential Housing Permits
This data is not provided by county, but rather metropolitan area. In the case of Snohomish County, I’m relying on the “Seattle Metro Area” which is essentially Snohomish, King, and Pierce County data. This data has a two month lag. Residential housing permits authorize new housing units to be built, but does not indicate if construction has started, or whether it will ever start, or complete.
Seattle Metro area as of September 2022, new housing permits for Single Family Residential (this is 1 unit, also denoted as "SFR"): 459 permits issued (August 2022 = 611, July 2022 = 564, June 2022 = 649 SFR).
Year to date there have been 5,694 SFR permits issued. Total SFR permits issued for Seattle Metro area through September is the 33rd highest (was the 28th as of August 2022) compared to the other 384 major cities and metro areas monitored.
The top US market for the most New Residential Housing Permits (1 unit) in September 2022 is the Houston-The Woodlands-Sugar Land, TX metro area with 3,700 new housing permits. Source: United States Census Bureau
Additional Reading
For additional reading and market insight, check out the following resources. The data is national, and not localized to the Seattle Metro area. Nevertheless, this is great information to include in a comprehensive analysis to gain a better understanding of the current, and future health of housing markets - local, regional, and national.
Home Mortgage Application (and refinance) data. This weekly survey data from the Mortgage Bankers Association (MBA) provides a forward looking indicator on the housing market by examining the number of people applying for home mortgage loans. The numbers are released weekly on Wednesday morning. Tip: Scroll down about halfway on the Mortgage Application Survey page to find the current, as well as previous releases.
NAHB / Wells Fargo Housing Market Index (HMI) is a monthly survey based on responses from NAHB member home builders focused on new single-family residential homes. The survey solicits builders' sentiment on the current housing market, as well as their take on the single family housing market looking outward six months. The survey also provides home traffic numbers. The data provides both a national and regional breakout.
That's A Wrap!
I hope these charts and my commentary / opinions provide you with some useful information and insight about the local Snohomish County real estate market and economy.
Please let me know in the below comments (or email) if this information is helpful and if you’d like to continue to see it monthly.
If you have any feedback I’d love to hear your thoughts. For those interested, I can also pull data beyond Snohomish County, or drill down by zip code if you're looking for additional or more specific data.
Thank you for taking the time to read!
Cheers!
-Joe


Comments