
June 2023 - Snohomish County Real Estate Trends
- Joe Frank

- Jul 31, 2023
- 10 min read
To see the latest real estate trend charts from January 2022 to June 2023 for Snohomish County, please check out my Housing Market & Economic Data page which offers charts that are updated monthly in real time.
The following data and charts represent monthly Snohomish County real estate trends from January 2022 to June 2023.
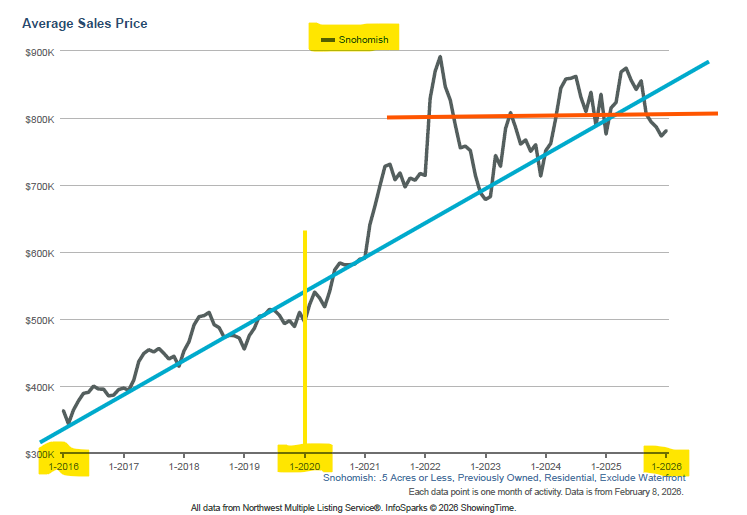
1. Snohomish County Real Estate Trend - Average Sales Price
For June 2023, the average sales price was $790,000 for Snohomish County, a significant jump from May 2023 which was $773,000 (and April's $722,000).
June's $790,000 average sales price is still not as high as last April's (2022) peak of $884,000, but these 2023 numbers continue to trend upward.
June's home prices continued to trend upward, which makes sense as these are homes that went under contract in late April and May. If a home is being financed with a mortgage loan, it normally takes 30 t0 45 days to close, and for that final sales price to be recorded and be pulled by the MLS and show in data such as I'm pulling here. Last month I incorrectly stated June should trend lower. Now for July data which I'll pull next month, I wouldn't be surprised to see a small decrease in average home prices, however I also wouldn't be surprised to see an uptick (see how I played it safe there!).
As in previous months, interest rates will play a role in house prices, however it would likely have to be a fairly dramatic move as it seems in general, buyers and sellers have adjusted to the mid 6.50 to low 7% rates.
To review the most recent trend data, please check out the Housing Data page here.
Average sales prices is a lagging indicator. These prices in most cases were agreed to one to two months ago (when an offer was accepted). Additionally, the fall and winter months are historically slower and prices tend to decline, and the late winter and spring (February through May), prices tend to rise. During the summer months prices tend to stabilize however will trend lower as we get closer to children heading back to school and the fall months.
2. Average Days on Market
Average Days on Market (DoM) indicates how many days a house is listed for sale (“on the market”) before an offer is accepted. When Days on Market increases, it indicates home buying demand is softening. This normally result in less offers, more buyer contingencies, increased housing supply, and ultimately, decreasing home prices.
For June 2023, DoM decreased further to 11. May was at 14, April was 19, and March 2023 was at 30 days. The downward trend continues as more buyers entered the market. Seasonality is at play - generally speaking - late February to May are the highest demand months for buyers (and when most sellers try to list). February 2023 was at 41 days.
To review the most recent trend data, please check out the Housing Data page here.
If you're looking to buy, you should be rooting for the Days on Market to be around 30 to 40 to ensure a more balanced market (where sellers don't have all the leverage).
3. Pending Sales
Pending Sales can be a leading indicator of what home sales will be within the next 30 to 60 days (the average time to close on a home once an offer has been accepted). Not all pending sales will close, however on average, 80% make it through closing and become a finalized home sale.
For June 2023 data, Pending Sales decreased slightly to 511 for Snohomish County. May was at 514 (this was adjusted from last month's blog data that indicated May at 545). I would suspect this number to continue a downward as we are in the midst of summer and heading toward fall where activity normally slows.
To review the most recent trend data, please check out the Housing Data page here.
4. Quantity of Homes For Sale (in MLS)
This metric indicates how many homes are listed for sale within the MLS in Snohomish County. It’s also referred to as housing inventory or supply.
For June 2023, the number of homes for sale increased to 373 from 303 in May and 293 in April.
We peaked in July 2022 with 1,200 homes for sale on the MLS.
This increase can be a good sign if you're a buyer, however is likely attributable to less buyer interest due to the time of year and rates that have stuck relatively high (per recent times) in the upper 6 to low 7% range.
Overall, the current number of homes for sale is still historically very low. The average number of homes for sale at any one time in Snohomish County over the past 10 years is about 700. The drastic decline directly correlates to the sustained mortgage rate increase, and therefore "home affordability". This affects both builders and home owners considering to build or sell, respectively.
To review the most recent trend data, please check out the Housing Data page here.
Along with higher mortgage rates, the lack of home supply is the main culprit to home prices remaining elevated. This is Econ 101 stuff - if there were more homes for sale (supply) then demand would lessen, and help drive down home prices, ultimately improving affordability.
To increase supply, you need more homes!
New builds may be the best option, but this takes times, and builders are well aware of an economy that may be in a recession or heading toward such (nobody seems to really know, but has their opinions!) Builders certainly don't want to overbuild and get stuck with inventory (nor drive prices significantly down).
Lastly, resale ("used") homes for sale is low due to the mortgage lock-in effect.
If you refinanced your home recently to a rate in the 2's or 3's, you likely don't want to move unless you absolutely must (or you're downsizing or moving to a lower cost area and able to pay cash, or a very large down payment). Selling your current home and buying a comparable home in the same area with with a mortgage rate of 6 or 7% will have a significant impact to your monthly mortgage payment.
5. New Listings
The New Listings data can help shed light on the health of our local housing market and whether we're trending toward a more healthy and balanced market relative to housing inventory / supply.
New listings is also influenced by the time of year - the peak season to list a home for sale is generally from about February to May.
To review the most recent trend data, please check out the Housing Data page here.
We witnessed another increase in June to 621. May was at 565 (revised from 593 from previous month) and April at 471 (revised from 482).
It will be interesting to see what July data shows. From monitoring our local market, it seems it may be trending back down as we get closer to kids beginning school and the fall season. Normally up until about June is the peak selling season.
6. Average Percent of Last List Price
This chart indicates the final sales price of a home over or under the original list price on the MLS. As you can see, Snohomish County hit a peak in March 2022 of 115%. This means, on average, in Snohomish County, homes were selling for 15% above the listed price. Example: A home was listed for sale at $700,000 and sold for $805,000.
To review the most recent trend data, please check out the Housing Data page here.
For June we saw a very slight dip to 101.1% (from May 2023 at 101.2%), still an increase from April's 100.9%. Homes are continuing to sell slightly over asking price on average.
I believe the recent increase is due to homes being more appropriately priced to the current market conditions along with buyers and sellers becoming accustomed to home prices and mortgage rates. March 2023 was at 99.1%, February 2023 was 97% (an increase from January's 94.9%).
7. Average Shows per Listing
The average number of people physically visiting and viewing homes for sale.
The trend continued lower, albeit very slightly to 10.1 for June. The upward trend ended May 2023, decreasing to 10.5 from April 2023 where we saw the number of average viewings hit 12.7 (from March at 12.5). We may have hit the peak for 2023 in April, as home sales generally decline as we get into the summer months.
To review the most recent trend data, please check out the Housing Data page here.
Further house showing data details for all regions of US available here from ShowingTime.com
8. Housing Affordability - Snohomish County
Housing Affordability has been decreasing since the start of 2021. Affordability has worsened recently due to continued high home prices coupled with mortgage interest rates that have doubled from the lows in 2020 and 2021.
The Housing Affordability Index (HAI) is updated quarterly and uses three key variables:
Median Home Prices
Median Household Income
Mortgage payment Cost (and assumes a 20% down payment).
Per the AWB Institute, the HAI is calculated by the Washington Center for Real Estate Research (WCRER) at the University of Washington. The HAI helps illustrate the ability (or inability) of middle-income households to make a mortgage payment on a median priced home.
"Affordable" in the space of this index equates to a household not paying more that 25% of their income toward the mortgage (principal and interest only).
A Housing Affordability Index of 100 is considered "affordable" (and a mortgage payment is exactly 25% of income). Below 100 is considered less affordable (or not affordable as you sink toward 0). Above 100 is considered more affordable.
The latest data from Quarter 1 of 2023 shows a slight improvement in home affordability within Snohomish County (and WA State). The Q1 2023 factor is 68.6 which is up (more affordable) from Q4 2022 of 65.2. In addition, Snohomish County became more affordable than the average of Washington State. This is the first time looking back to 2017. This can likely be attributed to decreasing home prices, and growing wages in Snohomish County (though not unique to Snohomish County).

Last Updated December 2022. Source: AWB Institute
9. Mortgage Rates
Mortgage rates have risen aggressively since the end of 2021 (and even looking back to January 2019). This has significantly affected home affordability due to low housing supply and home prices that remain high, coupled with these rising mortgage rates.
The following trend chart from Mortgage News Daily shows the 30 year fixed mortgage rates over the previous 12 months.
30 year mortgage rates have been hovering in the high 6 to low 7% range for the last few months. Two notable tops were 7.14% on May 26th and 7.22% just a few weeks ago on July 6th.
It's unknown at this point when (or if) mortgage rates will trend back down to 3 or 4 percent (5% actually sounds pretty good now!). Much will depend on inflation and the Fed's action to battle it with the Federal Funds Rate and how the bond and mortgage markets react.
Higher mortgage interest rates directly affect home affordability and therefore housing supply and prices - no doubt a very important metric to keep an eye on if looking to buy, sell, or refinance.
Average mortgage rate trend data for 30 year fixed mortgage over the last 12 months - July 31, 2022 through July 31, 2023:

Source: Mortgage News Daily
To gain a broader sense on the health of our local housing market and economy, following is some data and perspective on unemployment data along with new single family home construction permits. Such data can show signals and trends on the health of the economy, and ultimately the housing market.
Unemployment
This data is provided monthly by the Washington State Employment Security Department, and has a two month lag.
May 2023 unemployment data bumped up to 3.2% from February, March, and April numbers which were all in the high 2% range (below for actuals).
According to the Fed, they want to see the national unemployment rate reach at least 4%, as they feel this will help to slow the economy and help curb inflation. However this does not mean the Snohomish County Unemployment will hit that mark.
As of May 2023, Snohomish County Unemployment was at 3.2%
April 2023 = 2.7%, March 2023 = 2.5%, February 2023 = 2.6%, January 2023 = 3.7%, December 2022 = 3.2%, November 2022 = 3.1%, October 2022 = 3.3%, September 2022 = 3.3%, August 2022 = 3.4%, July 2022 = 3.3%, June 2022 = 3.1%, May 2022 = 2.9%, April 2022 = 2.3%)
Source: esd.wa.gov
New Residential Housing Permits
This data is not provided by county, but rather metropolitan area. In the case of Snohomish County, I’m relying on the “Seattle Metro Area” which is Snohomish, King, and Pierce County data.
Residential housing permits authorize new housing units to be built, but does not indicate if construction has started, or whether it will ever start, or complete (see below for a national and regional perspective on "Starts" and "Completions"). Data from the US Census Bureau has a two month lag.
Seattle Metro area as of May 2023, new housing permits for Single Family Residential (this is 1 unit, also denoted as "SFR"): 616 permits issued
April 2023 = 500, March 2023 = 515, February 2023 = 352, January 2023 = 359, December 2022 = 364, November 2022 = 357, October 2022 = 427, September 2022 = 459, August 2022 = 611, July 2022 = 564, June 2022 = 649
Year to date there have been 2,355 SFR permits issued (2022 total = 7,037). Total SFR permits issued for Seattle Metro area through May 2023 is the 29th highest (was 32nd in April) compared to the other 384 major cities and metro areas monitored.
The top US market for the most New Residential Housing Permits (1 unit) in May 2023 is still the Houston-The Woodlands-Sugar Land, TX metro area with 20,366 new housing permits.
The lowest US markets for the most New Residential Housing Permits in May 2023 are multiple with just a few issued - these include Danville, IL (3), Wheeling, WV-OH (3), and Fairbanks, AK (4).
For national and regional data and trends on Housing Permits, Starts, and Completions, check out this summary from the US Census Bureau on Monthly New Residential Construction. Source: United States Census Bureau
Additional Reading
For additional reading and market insight, check out the following resources. The data is national, and not localized to the Seattle Metro area. Nonetheless, this is great information to consider in a comprehensive analysis to gain a better understanding of the current, and future health of housing markets - locally, regionally, and nationally.
Home Mortgage Application (and refinance) data. This weekly survey data from the Mortgage Bankers Association (MBA) provides a forward looking indicator on the housing market by examining the number of people applying for home mortgage loans. The numbers are released weekly on Wednesday morning. Tip: Scroll down about halfway on the Mortgage Application Survey page to find the current, as well as previous releases.
NAHB / Wells Fargo Housing Market Index (HMI) is a monthly survey based on responses from NAHB member home builders focused on new single-family residential homes. The survey solicits builders' sentiment on the current housing market, as well as their take on the single family housing market looking outward six months. The survey also provides home traffic numbers. The data provides both a national and regional breakout.
That's A Wrap for June 2023!
I hope this monthly snapshot provides useful and relevant information, trends, and opinion about our local Snohomish County real estate market and economy.
Please let me know in the below comments (or email) if this information is helpful and if you’d like to continue to see it monthly.
If you have any feedback I’d love to hear your thoughts. For those interested, I can also pull data beyond Snohomish County, or drill down by zip code or even neighborhood if you're looking for additional or more specific data.
Thank you for taking the time to read!
Cheers!
-Joe


Comments