
Snohomish County Housing Market Update — January 2026
- Joe Frank

- Jan 2
- 4 min read
This Snohomish County housing data is extracted from the NWMLS and has a one month lag (data as of 12/31/25).
If you'd like more real-time data for a more specific and accurate analysis relative to your unique property, area, and/or situation, please reach out and I'd be happy to help.
Housing data is location sensitive. Even within a specific County, there are zip codes, communities, and even neighborhoods that defy the numbers discussed below. Of course when you zoom out and look beyond Snohomish and other area counties, or even Washington State, you're likely to see dramatic difference from the housing data and trends discussed below.
You can always view the latest Snohomish, Skagit, and King County housing data and charts along with other key housing and economic data here: www.joefrankrealtor.com/data
If you’d like to learn about a different area - whether within Snohomish or Skagit Counties, or beyond - please contact me at joe.frank@exprealty.com and I’d be happy to provide the data.
If you're thinking of buying or selling, here's what you need to know - and what it might mean for you.

How to Read My Housing Data Dashboard (and what it’s currently telling us)
If you’ve ever wondered, “Is the market heating up or cooling down?” or “Is now a good time to buy or sell?” — that’s exactly why I built my Housing Market & Economic Data page - you can view here.
On this page you’ll find trend data for Snohomish, Skagit, and King Counties, plus mortgage rates and a few economic indicators that can influence housing demand.
The housing charts focus on previously owned single family homes (.5 acre or less). The housing data updates the end of each month and has a one-month lag (which is normal with real estate reporting).
What We’re Seeing Lately
Because we’re in winter, it’s important to factor in seasonality where activity usually slows in late fall and winter, then ramps up sharply in spring. That means prices and demand can look softer in the fall and winter (especially November and December), and then change quickly as we head into February - May timeframe.
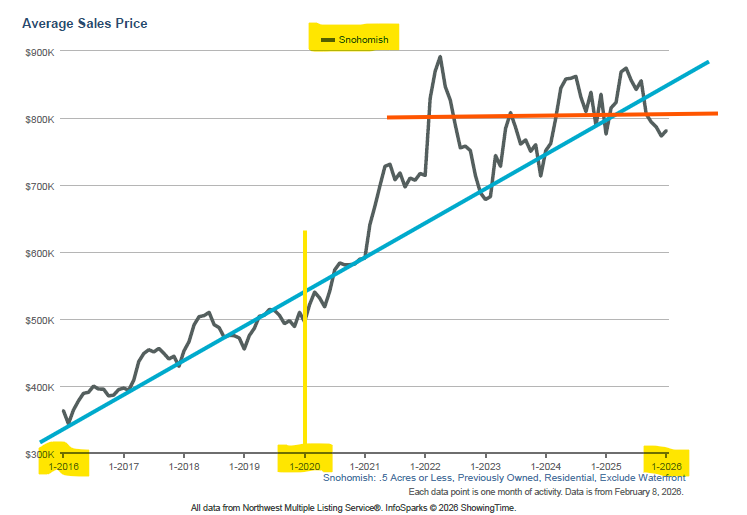
Snohomish County: Cooling from peak competition, but still active
Recent trend snapshot (data as of 12/31/25):
Average Home Sales Price: $771K, down 8% from Dec 2024
Homes selling in about 37 days, slower than last year (Dec 2024 = 31 days)
Sale Percent to Original List Price: 97%, down 1% from Dec 2024
Seasonality: It’s common for Snohomish to cool into winter (fewer buyers shopping during holidays), and then tighten again in spring when listings and buyers both surge.
Skagit County: Prices up, but demand signals are mixed
Recent trend snapshot (12/31/25):
Average Home Sales Price: $588K, up 1.7% from Dec 2024
Homes selling in 42 days (the same as Dec 2024)
Sale Percent to Original List Price: 96.9%, up .03% from Dec 2024
Seasonality lens: Skagit can be more sensitive to the “right buyer for the right property.” Spring typically brings more listings and more serious buyers.
King County: Similar pattern — slower pace and slightly softer pricing
Recent trend snapshot (12/31/25):
Average Home Sales Price: $1,046M, down 2.4% from Dec 2024
Average days on market: 41 days, slower than Dec 2024 at 34 days
Seasonality lens: King County often “wakes up” fast in early spring. If rates dip even modestly, competition can return quickly in the most desirable neighborhoods and school zones.
Why Winter Data Can Mislead People (Seasonality in Plain English)
Here’s the pattern most years:
Nov–Jan: fewer listings, fewer buyers, longer days on market, more price reductions
Feb–May: listings jump, buyers return, competition increases
Jun–Aug: peak pricing and activity (often), then it gradually cools
Sep–Oct: back-to-school slowdown begins
So when you see winter softness, the key question is: Is it seasonal… or is it a bigger shift?
That’s why looking at multiple metrics together (inventory + days on market + sale-to-list + pending sales) is so helpful.
My 2026 Outlook: Inventory, Prices, and Mortgage Rates
No one can truly predict the housing market action and price directions for 2026 — but we can outline likely paths using current data and forecasts.
Mortgage Rates in 2026: Probably “low-to-mid 6s,” with a chance to drift under 6%
Freddie Mac’s weekly survey had the 30-year fixed around 6.15% at the end of 2025. Freddie Mac+1
Realtor.com forecasts ~6.3% average mortgage rates in 2026. Realtor
Fannie Mae projected rates ending 2026 around ~5.9% (their September 2025 outlook). Fannie Mae
MBA commentary has also pointed to rates around mid-6% by end of
2026 (depending on spreads and the broader economy). MBA
My take: If we spend meaningful time near (or below) 6%, buyer confidence improves fast — especially in King and Snohomish County.
Inventory in 2026: Likely to improve, but still not “normal”
Nationally, Realtor.com expects for-sale inventory to keep recovering (they project roughly +9% year-over-year in 2026). Realtor
My take locally: More sellers list when rates stabilize and life happens (jobs, kids, downsizing, estate sales). But many homeowners are still sitting on very low mortgage rates from prior years, which will likely continue to limit inventory.
Home Prices in 2026: Modest growth or sideways, with big neighborhood variation
Realtor.com expects modest home price growth nationally in 2026 (low single digits).
My take locally: I’d expect a “two-speed” market.
Move-in-ready homes in great locations can still see competition and price strength
Homes needing work and/or are overpriced will see longer market times and more price reductions
How to Use This Dashboard If You’re Buying or Selling
Buying
Watch for:
Rising inventory + longer days on market (more negotiating power)
Sale-to-list percentage continuing to drift downward (under 100% means homes are selling for under asking price)
An increase in price drops (more opportunity) - you can view price drop data on Redfin by city or zip.
Selling
Watch for:
Improving pending sales and showings
Days on market tightening as spring approaches
The “first two weeks” performance window (pricing a home right is critical - don't let it sit)
Want a More Localized Read for Your Neighborhood?
County trends are helpful — but real estate is hyper-local. If you want this same analysis by city, zip code, or neighborhood, I can pull it and translate it into plain English for your situation. Email me any time: joe.frank@exprealty.com


Comments