


Snohomish County Housing Market Update for September 2026: Prices Rise, but Inventory Is Up Nearly 40%

Published October 10, 2026
For the latest local housing data from Snohomish, Skagit, and King Counties, as well as other key real estate and economic data, visit: JoeFrankRealtor.com/data, or contact me at JoeFrankRealtor.com/contact.
Latest Snohomish County Housing Market Update for September 2026
The Snohomish County housing market definitely sent mixed signals in September.
The average sales price rose to $825,000. At the same time, homes took longer to sell, buyers paid less compared with the original list price, and resale (existing homes) inventory was up almost 40% over one year ago.
In simple terms, home values are holding up, but buyers have more choices and more room to negotiate. This is not the fast seller's market we saw a few years ago. It is a slower and more careful market. Similar message we've been sharing over the last several months.
For sellers, price and presentation matter more than ever. For buyers, there may be more time to compare homes, ask for repairs, or request help with closing costs. Still, the best homes in the best locations can sell quickly.
Important Note About This Snohomish County Housing Data
The Snohomish County housing market update for September 2026 is based on the most recent data available as of September 30, 2026. It does NOT include condos, newly built (i.e new construction) homes, waterfront homes, and homes on more than a half-acre. This helps to normalize the data and keeps the focus on the average resale home.
If you ever need details about newly built homes, waterfront homes, homes on acreage, condos, or another property type, please always feel free to contact me. I'd be happy to provide the specific data you're looking for.
It's very important to understand that these numbers are countywide averages. They are not a value estimate for any one home. Prices, days on market, and price reductions can vary considerably by city, neighborhood, community, property type, school area, and even the street.
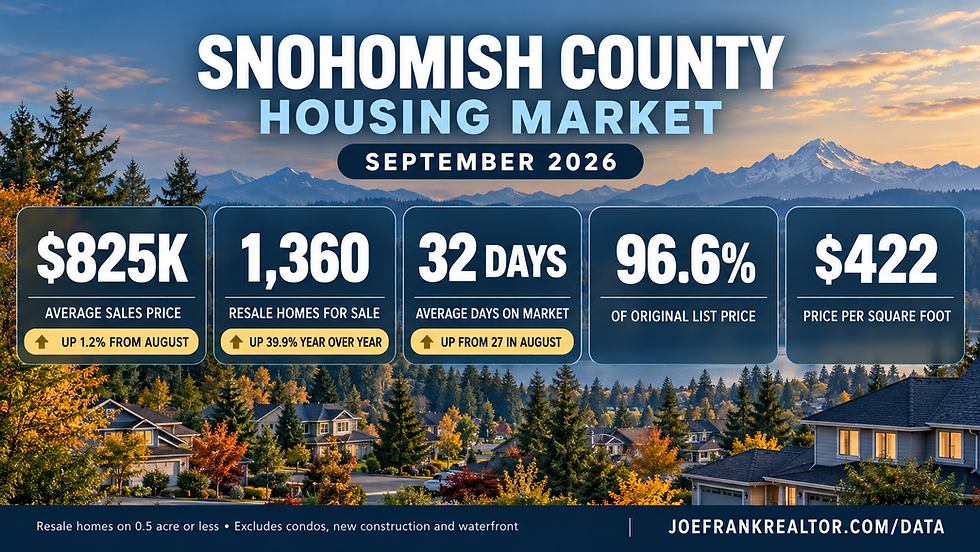
September 2026 Snohomish County Housing Market at a Glance
Average Sales Price Increased to $825,000
September 2026: $825,000
August 2026: $815,000
Month-over-month change: Up 1.2%
September 2025: $798,000
Year-over-year change: Up 3.4%
Why it may have changed: A different mix of homes may have closed in September. For example, more sales in higher-priced areas or more large homes can raise the county average.
What it may signal: Prices are still holding up across the county. However, one month of higher average prices does not mean every home gained 3.4% in value. Your home's change may be higher, lower, or even negative.
New Listings Increased to 640
September 2026: 640 new listings
August 2026: 631 new listings
Month-over-month change: Up 1.4%
September 2025: 620 new listings
Year-over-year change: Up 3.2%
Why it may have changed: Some owners may be listing now before the slower holiday season. Others may feel they can move because their home equity remains strong.
What it may signal: Buyers should keep seeing fresh choices. Sellers will need to watch new competition closely, especially in the first two weeks after listing.
Resale Home Inventory Increased to 1,360
September 2026: 1,360 resale homes for sale
August 2026: 1,357 resale homes for sale
Month-over-month change: Up 0.2%
September 2025: 972 resale homes for sale
Year-over-year change: Up 39.9%
Why it may have changed: More homes are staying on the market likely because buyers are not as eager to jump into the market. Afterall, they're dealing with high mortgage rates and higher prices in general (especially gas and diesel).
What it may signal: Buyers have considerably more choice than they did just a year ago. Sellers should not assume a home will sell quickly just because prices rose countywide.
As a side note (since it does impact resale home prices), there were 431 new construction homes listed for sale in September. This is the highest number in the available dataset which goes back to 2006!
When new construction and resale inventory are added together, Snohomish County had 1,791 homes for sale as of September 30, 2026, which is still 51.2% below the July 2008 peak of 3,669 homes during the Great Recession.
The new construction numbers do matter because sellers may compete with builders that offer rate buydowns, closing-cost help, or upgrade packages. It also gives buyers another option. Still, today's total inventory is far below the 2008 peak, so the data does not point to a repeat of that period by itself.
Days on Market Increased to 32 Days
September 2026: 32 days
August 2026: 27 days
Month-over-month change: Up 18.5%
September 2025: 29 days
Year-over-year change: Up 10.3%
Why it may have changed: Seasonally speaking, this is to be expected. Fall is often slower than summer. Higher mortgage rates also likely caused some buyers to pause or to conside a different price range which can prolong the home search and purchase price.
What it may signal: Sellers should plan for a longer sale and shouldn't panic if the home doesn't sell in the first weekend or even within a couple weeks. Buyers may have more time, but a well-priced home will still move relatively fast.
Final Sales Price Fell to 96.6% of the Original List Price
September 2026: 96.6% of the original list price
August 2026: 97.4%
Month-over-month change: Down 0.8 percentage points, or about 0.8%
September 2025: 97.2%
Year-over-year change: Down 0.6 percentage points, or about 0.6%
Why it may have changed: More inventory and slower demand gave buyers room to negotiate. The market is also forcing sellers to conduct price cuts before going under contract.
What it may signal: Starting too high can cost a seller time and money. Buyers may be able to negotiate, but the amount will depend on the home, price, condition, and local demand. A good selling and pricing strategy is key in this market to ensure market timing and the list price are strategic, and appropriate for the area, season, and market.
Price per Square Foot Increased to $422
September 2026: $422 per square foot
August 2026: $408 per square foot
Month-over-month change: Up 3.4%
September 2025: $423 per square foot
Year-over-year change: Down 0.2%
Why it may have changed: The homes that sold in September may have been newer, smaller, updated, or located in higher-priced areas. Those homes often sell for more per square foot. There are many variables that can affect this value, and should not be used alone to estimate a home's value.
What it may signal: On a per-square-foot basis, the market was almost flat from one year ago. This is another sign that the higher average sales price may partly reflect which homes sold, not the same gain for every property.
Shows to Pending Stayed Flat at 12
September 2026: 12 showings before a pending sale
August 2026: 12 showings
Month-over-month change: 0.0%
September 2025: 12 showings
Year-over-year change: 0.0%
Why it may have changed: Buyer activity per successful sale stayed steady, even as homes took longer to sell.
What it may signal: Buyers are still shopping, but they are taking their time. A home may need more days on the market to gather the same number of serious showings.
Is Snohomish County a Buyer's or Seller's Market in September 2026?
Bottom line - Snohomish County is not one simple market. This goes for any county or even town or city. So the answer to the question really depends on what pocket of Snohomish County you’re looking in. Overall however, we are definitely rooted in a buyers market, as they have the leverage due to many more homes on the market than the previous several years.
For a clean, updated, well-priced home in a popular area, the seller may still have the edge.
For a home that needs work, not in a preferred location, or the list price starts too high, the buyer will have more leverage and ability to negotiate price down, and or request seller concessions.
Countywide, the market moved once again more toward buyers in September because:
Resale inventory was up 39.9% from last year.
Days on market rose to 32.
The average sale closed at 96.6% of the original list price.
New construction inventory reached a record high in this dataset.
However, average sales prices were still 3.4% higher than one year ago. This looks more like a minor market adjustment and a small move toward balance than any type of housing crash.
What Is Driving the Snohomish County Housing Market?
Mortgage Rates Are the Biggest Short-Term Factor
Mortgage rates rose fast at the end of September. Freddie Mac reported that the average 30-year fixed mortgage reached 7.28% on October 1, 2026. It was 7.03% one week earlier and 6.34% one year earlier.
I prefer to use mortgage rate data from Mortgage News Daily (it's more current), which indicates we hit 7.54% on October 1st, and high of 7.61% as of this writing (October 10th)
Rates near or above 7% can change a buyer's monthly payment by hundreds of dollars. That can lower the price a buyer can afford. It can also keep current owners from selling if they have a much lower rate on their present home - the mortgage lock in effect which is back in vogue for folks with mortgage rates of ~ 6% or less and do not need to move. You can read more about the Mortage Rate Lock-In Effect from an article I wrote back in 2022.
Mortgage rates can change quickly. A national average is not a quote for every buyer. Credit score, loan type, down payment, lender / broker, point buy-downs, and daily bond-market changes all matter.
Inflation and the Federal Reserve Are Keeping Borrowing Costs High
The Bureau of Labor Statistics reported that consumer prices were up 3.4% from one year earlier in August. Energy prices were up 16.3%. Inflation was still above the Federal Reserve's 2% goal.
On September 16, the Federal Reserve raised its target rate by one-quarter point to a range of 3.75% to 4.00%. The Fed said inflation remained high and uncertainty was elevated, in part because of events around the world.
The Fed does not set mortgage rates. Still, inflation, Fed policy, and long-term Treasury yields all affect the cost of home loans. Mortgage rates are tied to the 10 year treasury rate, plust a risk spread or premium -- learn more here.
Jobs in Snohomish, King, and Skagit Counties Still Matter
Jobs support home sales because people need steady income to buy and keep a home.
The latest available county data for August showed unemployment at 4.8% in Snohomish County, 4.7% in King County, and 4.8% in Skagit County. These county rates are not seasonally adjusted. Washington's seasonally adjusted unemployment rate was 4.9% in August, according to the Washington Employment Security Department. National job growth also slowed. The U.S. Bureau of Labor Statistics reported 29,000 new jobs in September. The national unemployment rate was 4.2%.
National average hourly pay was up 3.0% from one year earlier. Hourly pay is a key component for housing affordability. If wages are keeping up with, or exceeding inflation, consumers feel better about spending, including on homes. However, mortgage rates remain a key piece of the puzzle as they can considerably dictate a housing payment.
None of this data indicates any type of a job collapse. But slower hiring and wage growth can make buyers more careful about spending, especially on larger ticket items and non-essentials.
King County and the Seattle Metro Can Affect Snohomish County
Snohomish County does not move on its own. Buyers often compare homes in King, Snohomish, and Skagit Counties. Job changes in Seattle and Bellevue can also change demand north of the county line.
Realtor.com's September report showed that active listings in the Seattle-Tacoma-Bellevue metro were up 28.5% from one year ago. The median list price was down 2.4%, and 25% of listings had a price cut.
That report covers a much larger area and uses a different property mix than the Snohomish County data we're digging into within this article, so the numbers should not be compared directly. Still, both data sets point to more choice and more price sensitivity across the region.
War, Tariffs, and Politics Can Reach the Local Housing Market
Events far from Snohomish County can still affect a local home sale.
The conflict with Iran has pushed up global energy costs and long-term bond yields.
Reuters reported that the October 1 mortgage-rate increase was the largest weekly jump in about four years. Higher energy costs can add to inflation, which can keep mortgage rates higher for longer.
Tariffs can also raise the cost of lumber and other building materials. The National Association of Home Builders reported that the combined tariff rate on Canadian softwood lumber was 35.9% in September. Higher building costs can make new homes more expensive, even when builders have more inventory to sell.
The November midterm election and debates over taxes, housing, trade, and federal spending may add uncertainty. No one election decides a home's value. But policy changes can affect jobs, confidence, inflation, building costs, and interest rates.
What Could Happen to Snohomish County Home Prices Next?
The next three to six months will likely be bumpy and unpredictable.
Seasonality is now in play as fall and winter are often slower months for housing. With more inventory and mortgage rates above 7% at the start of October. Buyers will likely remain cautious and be in search of well presented homes in great areas, or great deals / discounts. This could lead to more price cuts, seller credits, and longer market times.
At the same time, Snohomish County still has strong long-term demand drivers. It is close to major King County job centers. It also has limited land in many popular areas. Those facts can help support prices when jobs stay steady.
The Fannie Mae September housing forecast expected national home prices to rise 2.3% in 2026 and 1.0% in 2027. It also expected the average 30-year mortgage rate to stay near 6.8% in late 2026 and 6.7% in 2027. However, that rate forecast used information available on August 31, before the late-September jump. Forecasts can change quickly.
Three paths are possible:
Most likely: A slower fall and winter, with flat to modest price changes and more negotiation. Results will vary widely by area and home type.
Stronger market: If mortgage rates fall and jobs stay steady, more buyers may return. Good homes could sell faster and prices could hold or rise.
Weaker market: If rates stay high, jobs weaken, or inventory keeps building, sellers may need larger price cuts and countywide prices could soften.
A sharp countywide price drop is not the main signal in today's data. But higher inventory means sellers have less room for error than they had in recent years.
What the September 2026 Market Means for Snohomish County Home Sellers
Sellers can still do well, but the plan matters.
Price from current local sales. A sale from last spring will not show what buyers will pay today.
Study your direct competition. Look at similar homes in the same community, school area, and price range.
Prepare the home well. Cleaning, small repairs, simple updates, staging, and strong photos / marketing can help a home stand out.
Plan for more time. The county average rose to 32 days on market, and some homes will take longer. Be prepared for this, or longer as we enter the slower fall and winter months.
Watch builder competition. New-home builders may offer incentives that a resale seller needs to answer with price, condition, or flexibility. This is especially true if such homes are near you and can be considered competition.
Be ready to negotiate. The average sale closed at 96.6% of the original list price, but your result could be very different.
The first list price sends a strong message. A price that is too high can reduce showings and cause the home to sit. Later price cuts may not create the same excitement as a strong launch.
What the September 2026 Market Means for Snohomish County Home Buyers
Buyers have more choices, but affordability is still hard.
Set the monthly payment first. Do not shop only by purchase price.
Compare lenders. Rates, points, and fees can vary.
Ask about seller help. A credit for closing costs or a rate buydown may be more useful than a small price cut.
Keep useful protections. More inventory may make it easier to include an inspection or financing terms.
Do not assume every seller will discount. A strong home with a fair price can still attract more than one buyer.
Compare resale and new construction carefully. Look at the full cost, including upgrades, yard work, window coverings, homeowners association dues, and builder incentives.
If rates fall later, refinancing may be possible, but it is never guaranteed. A buyer should be comfortable with the payment they accept today.
What Is My Snohomish County Home Worth in Today's Market?
County averages cannot answer this question by itself. Your home's value depends on its location, size, age, condition, floor plan, lot, view, updates, nearby sales, nearby listings, and buyer demand.
Home values and buying / selling activity within micro-markets can vary considerably from Everett to Edmonds, Lynnwood to Lake Stevens, Bothell to Marysville, or Monroe to Stanwood. They can also change inside the same city, community, neighborhood, or even streets.
If you're thinking about selling, refinancing, moving, or just want to know where you stand, I can prepare a detailed market and home-value review for your property. It's always free, with no obligation and no pressure.
Final Takeaway
September brought a small rise in average sales price and price per square foot. It also brought more days on market, a lower sale-to-original-list ratio, and nearly 40% more resale inventory than one year ago.
For sellers, this means careful pricing and strong preparation are more important than ever. Market timing and seasonality should also be considered if there is not an immediate need to list a home for sale. For buyers, it means you have a lot more choices and a better chance to negotiate. For homeowners, it means your value may still be holding up, but countywide averages are not enough to judge one property.
The market has been normalizing over the last few years, not moving in one straight line down. The best decisions still come from current local market data for the exact home and area you're looking to buy or sell within.
Thank you for taking the time to read this article, and please reach out if I can help you in any way.
Cheers,
Joe Frank
Disclaimer: This article is for general information only. It is not financial, legal, tax, lending, or investment advice. Housing data can be revised and may use different methods across sources. Market forecasts are estimates, not guarantees. Mortgage rates and loan terms vary by borrower and lender. Please speak with qualified professionals about your situation.
Listen to the podcast for this article below. It can also be found by searching "Real Estate Unlocked - AI Blog Article Discussion" on Spotify and Apple Podcasts. * Please note that the podcast is AI generated based on this blog article.
References and Additional Reading
Northwest Multiple Listing Service — Local housing data supplied for this article
ShowingTime — Local showing activity data supplied for this article
U.S. Bureau of Labor Statistics: September 2026 Employment Situation
Washington Employment Security Department: August 2026 State Employment Report
Washington Employment Security Department: Snohomish County Profile
Washington Employment Security Department: King County Profile
Washington Employment Security Department: Skagit County Profile
National Association of REALTORS®: August 2026 Existing-Home Sales
National Association of Home Builders: Framing Lumber Prices and Tariffs
For the latest local housing data from Snohomish, Skagit, and King Counties, as well as other key real estate and economic data, visit: JoeFrankRealtor.com/data, or contact me at JoeFrankRealtor.com/contact.


Comments