


Snohomish County Housing Market Update for August 2026: Prices Rebound Monthly, but Inventory Is Up 47%

Published September 5, 2026 | Housing data through August 31, 2026
For the latest local housing data from Snohomish, Skagit, and King Counties, as well as other key real estate and economic data, visit JoeFrankRealtor.com/data, or contact me at JoeFrankRealtor.com/contact.
Latest Snohomish County Housing Market Update for August 2026
In a nutshell, the August 2026 Snohomish County housing market delivered a mixed message. The average sales price increased from July, but it remained below last year.
Meanwhile, buyers continued to benefit from considerably more inventory, longer market times, and greater negotiating room than they had a year ago.
The market has not stopped moving, but buyers are being more selective and sellers need to be more strategic, and precise. Well-priced and well-prepared homes can still sell successfully, and tend to not linger on the market. Homes that miss the mark on price, condition, presentation, or location are more likely to sit longer or require a price reduction.

Important Note About This Snohomish County Housing Data
The following NWMLS and ShowingTime data is as of August 31, 2026 and excludes condominiums, newly built homes, waterfront homes, and homes on more than one-half acre. Limiting the data this way helps normalize the numbers and keeps the focus on the average resale home rather than substantially different property categories, including new construction homes.
This latest Snohomish County Housing Market Update for August 2026 does not include sufficient detailed data to assess your homes value - current or looking forward. If you would like information specific to new construction, waterfront homes, acreage, condominiums, a particular city, or an individual neighborhood, please reach out to me. I'd be happy to provide more focused data you may be seeking.
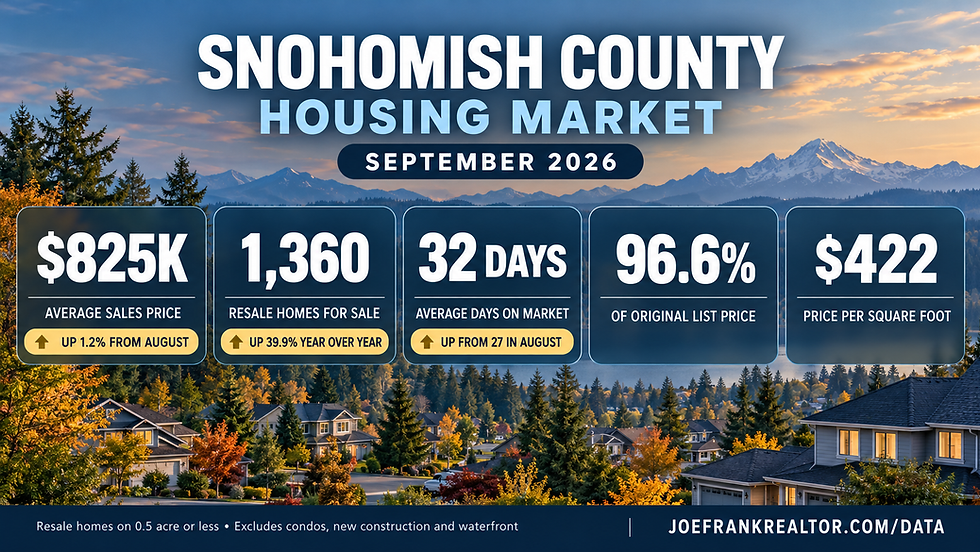
August 2026 Snohomish County Housing Market at a Glance
Average Sales Price: $807,000. Up 2.0% from July, but down 5.6% year over year.
The average increased from $791,000 in July to $807,000 in August. In August 2025, the average was $855,000. The monthly rebound is encouraging for sellers, but the year-over-year decline shows that buyers still have more leverage than they did last summer. Keep in mind that an average can also move when the mix of homes sold changes. Because price per square foot declined in August, the higher average price does not necessarily mean every home gained value.
New Listings: 634. Down 23.0% from July, but up 19.6% year over year.
New listings decreased from 823 in July to 634 in August. That seasonal slowdown is common as summer comes to a close. However, August still produced considerably more new listings than the 530 recorded in August 2025. Fewer new listings may help prevent inventory from rising further this fall, but sellers still face more competition than they did last year.
Homes For Sale (current housing inventory): 1,242. Down 5.8% from July, but up 47.2% year over year.
Active resale inventory declined from 1,318 in July to 1,242 in August, but remained far above the 844 homes available one year earlier. This is one of the clearest signs that market conditions have shifted. Buyers generally have more choices and more time to compare homes, while sellers need to pay closer attention to competing listings, recent pending sales, price reductions, and buyer feedback.
As a side note, new-construction inventory hit 396 homes. This was the highest monthly new-construction count since October 2018, when 408 newly built homes were available. Combining new construction with resale inventory produced 1,638 homes for sale as of August 31, 2026. That is still well below the 3,669 homes available in July 2008 during the Great Recession. Today’s inventory growth deserves attention, but the total remains far from the extreme oversupply seen during that period. New construction also matters to resale sellers because builders may compete with mortgage-rate buydowns, closing-cost credits, warranties, and other incentives.
Days on Market: 27 days. Up 12.5% from July and 3.8% year-over-year.
The average increased from 24 days in July to 27 days in August, compared with 26 days in August 2025. Three extra days may not sound significant, but it fits the broader pattern of buyers taking more time and having less urgency. Correct pricing during the first few weeks is increasingly important because overpriced listings can lose momentum quickly.
Final Sales Price as a Percentage of Original List Price: 97.4%.
A slight decrease from 98.0% in July and from 97.7% in August 2025. The month-over-month change was down 0.6 percentage points, equivalent to a relative decline of approximately 0.6%. Buyers are negotiating more successfully, and sellers should not assume that starting high will automatically produce a stronger final price.
Price per Square Foot: $409. Down 3.3% from July and 3.8% year over year.
Price per square foot decreased from $423 in July and from $425 in August 2025. This supports a more cautious reading of the monthly increase in average sales price. The homes sold in August may simply have included a greater share of larger or higher-priced properties. Price per square foot is useful for identifying direction, but it should never be used by itself to value a home because lot, condition, updates, layout, location, view, school area, and other features can create major differences.
Shows to Pending: 12 days. Unchanged from July and down 7.7% year over year.
It took an average of 12 showings for a home to go pending in both July and August, compared with 13 in August 2025. This does not mean demand strengthened across every price range. Instead, it suggests that homes attracting qualified buyers can still convert efficiently, while other listings may receive little activity. The gap between desirable, correctly priced homes and everything else is becoming more noticeable.
Is Snohomish County a Buyer’s or Seller’s Market in August 2026?
Overall, Snohomish County is more balanced -- and more buyer-friendly -- than it was just a year ago. Inventory is up sharply, days on market are slightly longer, price per square foot is lower, and homes are selling farther below their original asking prices.
That does not automatically make every neighborhood a buyer’s market. Snohomish County is large and highly varied. Conditions can differ substantially between Mill Creek, Bothell, Everett, Edmonds, Lynnwood, Lake Stevens, Marysville, Mukilteo, Snohomish, Monroe, and other communities. They can also differ within the same zip code based on price, home style, age, lot size, condition, school boundaries, commute routes, HOA rules, and even nearby new construction.
This is why countywide averages should be treated as background, and definitely not as a valuation for a specific home.
What Is Driving the Snohomish County Housing Market?
Mortgage Rates Remain the Biggest Affordability Hurdle
Freddie Mac reported that the average 30-year fixed mortgage rate reached 6.71% on September 3, 2026, up from 6.66% the prior week and 6.50% one year earlier. Even small rate changes can materially affect a buyer’s monthly payment and maximum purchase price. If you prefer to rely on Mortgage News Daily mortgage rates (often a more realistic rate of what a consumer would encounter when pursuing a mortgage), we hit a recent high of 6.91% on September 2, 2026.
Mortgage rates are influenced more directly by inflation expectations and longer-term bond yields than by any single Federal Reserve decision. The 10-year U.S. Treasury yield stood at 4.77% on September 3, helping explain why mortgage rates remained elevated.
Inflation Is Easing in Some Areas, but Energy Costs Are a Risk
The Consumer Price Index increased 3.4% over the 12 months ending in July 2026, while core inflation excluding food and energy increased 2.5%. Energy prices were up 14.7% year over year. Inflation is below its recent peak, but it remains high enough to keep financial markets sensitive to energy prices, tariffs, supply disruptions, and geopolitical events.
The Federal Reserve held its federal-funds target range at 3.50% to 3.75% on July 29. Its next scheduled policy meeting is September 15 and 16. The Fed doesn't set mortgage rates directly, and even a future change in its policy rate would not guarantee an equal move in home-loan rates.
The Job Market Is Still Supporting Housing Demand, but Local Conditions Matter
The U.S. added 162,000 jobs in August, the national unemployment rate remained 4.1%, and average hourly earnings increased 3.1% over the prior year. Continued employment and wage growth help households qualify for homes, but a meaningful slowdown in hiring would reduce buyer confidence and housing demand. (U.S. Bureau of Labor Statistics). In addition, wage increases must meet or exceed inflation in a sustained manner, to make a material difference and enable people to get ahead, and be able to save for home down payments, pay higher mortgage rates. Otherwise, assuming that mortgage rates remain elevated, home values will continue to trickle down or stay flat.
The latest available county data, as of July 2026, reported unemployment rates of 5.0% in Snohomish County, 4.9% in King County, and 3.8% in Skagit County.
These county figures are not seasonally adjusted. King County employment matters greatly because many Snohomish County residents commute south, while Skagit County can influence demand along the northern part of the county. (Washington Employment Security Department: Snohomish, King, and Skagit)
War, Tariffs, and Political Uncertainty Can Reach the Housing Market Indirectly
Renewed U.S. and Iran military hostilities pushed oil prices and global bond yields higher in early September.
For housing, the most important effects are indirect: higher energy costs can add to inflation, inflation can keep bond yields elevated, and higher bond yields can increase mortgage rates.
Tariffs and trade restrictions can also increase the cost of lumber, metals, appliances, and other building materials and inputs. Back in May 2026, the National Association of Home Builders reported that construction-material costs, are impacted by several factors, including tariffs, were 46.1% higher than in February 2020, compared with a 24.7% rise in overall inflation during the same period. Higher construction costs can limit the supply of less-expensive new homes and make remodeling more costly.
These events do not produce a simple one-for-one change in Snohomish County home values. Their impact depends on how long they last and how strongly they affect inflation, interest rates, employment, consumer confidence, and construction costs.
What Could Happen to Snohomish County Home Prices Next?
My base case for the next three to six months is a more balanced market with uneven results, rather than either a sharp rebound or a broad collapse. This is me saying it's impossible to predict the future, especially with so many variables at play, including upcoming mid-term elections in November.
The most likely path: Inventory should decline seasonally during fall and winter, which may help stabilize prices. However, affordability and mortgage rates near the upper-6% range are likely to limit how aggressively buyers compete. Prices may move up or down from month to month depending on the mix of homes sold.
A stronger-market scenario: If inflation cools, geopolitical tensions ease, and bond yields and mortgage rates move lower, some sidelined buyers could return. Combined with normal seasonal inventory declines, that could support well-positioned listings and improve sales activity.
A softer-market scenario: If energy costs, tariffs, federal borrowing concerns, or geopolitical escalation push inflation and long-term rates higher, or if hiring weakens in Snohomish and King Counties, buyers could lose purchasing power and become even more price-sensitive.
National forecasts are generally calling for modest price growth rather than dramatic appreciation. Fannie Mae’s August forecast projected national home-price growth of 2.3% in 2026 and 1.0% in 2027, while its third-quarter survey of more than 100 housing experts produced average expectations of 2.5% for 2026 and 2.2% for 2027.
These are national forecasts, not predictions for Snohomish County or an individual home, and they may be revised as conditions change.
Sellers - What the August 2026 Market Data Means for Snohomish County
This is still a workable market for sellers, but strategy matters more than it did when inventory was extremely limited.
Price from current competition—not from last year’s peak or an automated estimate. Buyers can compare more homes and are quicker to reject an unrealistic price.
Study price reductions and failed listings, not only closed sales. Active, pending, expired, and canceled listings can reveal where buyers are resisting price.
Prepare the home carefully. Repairs, cleaning, presentation, professional photography, and easy showing access can separate a listing from the growing competition.
Compare against new construction. Nearby builders may offer financing incentives or closing-cost credits that affect how buyers evaluate a resale home.
Expect negotiation. With the average home selling for 97.4% of its original list price, sellers should plan for inspection requests, concessions, or price discussions rather than assuming a full-price sale.
The best pricing plan depends on your specific neighborhood, price range, competition, condition, and timing - not on the county average alone.
Buyers - What the August 2026 Market Means for Snohomish County
Buyers generally have more choices and negotiating room than they did last year, but affordability remains challenging.
Watch both price and mortgage rate. A lower purchase price may not fully offset a higher interest rate, so compare estimated monthly payments before making an offer.
Ask about seller credits or a rate buydown. In some cases, a negotiated credit may improve affordability more than the same dollar reduction in price.
Do not assume every listing is overpriced. Correctly priced homes in desirable locations can still sell quickly, especially if they are updated and have limited competition.
Use the inspection and financing protections appropriate for your situation. More inventory often gives buyers room to perform careful due diligence.
Compare resale homes with builder incentives. The best value is not always the home with the lowest list price; financing, repairs, warranties, lot, location, and future resale should all be considered.
What Is My Snohomish County Home Worth in Today’s Market?
Countywide averages cannot answer that question accurately. Values, days on market, buyer activity, and frequency of price reductions can vary widely across Snohomish County— and even between nearby neighborhoods.
A useful home-value analysis should consider:
Recent comparable sales and current competing listings
Pending sales and recent price reductions
Neighborhood and school-boundary differences
Home condition, updates, age, layout, and lot
View, privacy, traffic, noise, HOA, and location influences
Nearby new construction and builder incentives
The price range where buyers are currently most active
If you are considering selling, or simply want to understand what your home may be worth now and how your local market is changing, I can prepare a free, no-obligation home-value and market assessment focused on your specific property and area. You can request here, or contact me at JoeFrankRealtor.com/contact.
Final Takeaway
The August 2026 Snohomish County housing market was neither fully strong nor fully weak. The average sales price improved from July, but the year-over-year decline in price, the 47.2% increase in resale inventory, the lower price per square foot, and the weaker sale-to-original-list-price ratio all show that buyers have gained leverage.
For sellers, preparation and accurate pricing are increasingly important. For buyers, additional choices and negotiating room are helpful, but mortgage rates remain a major affordability obstacle.
For homeowners watching their equity, the most useful answer will come from neighborhood-level and property-specific data, not a countywide headline.
Housing markets, mortgage rates, economic forecasts, tariffs, and geopolitical conditions can change quickly. This article is for general educational purposes and should not be treated as a guarantee of future prices, a property appraisal, financial advice, tax advice, or legal advice.
For the latest local housing data from Snohomish, Skagit, and King Counties, as well as other key real estate and economic data, visit JoeFrankRealtor.com/data, or contact me at JoeFrankRealtor.com/contact.
Thank you for taking the time to read this article!
Cheers,
-Joe
Listen to the podcast for this article below. It can also be found by searching "Real Estate Unlocked - AI Blog Article Discussion" on Spotify and Apple Podcasts. * Please note that the podcast is AI generated based on this blog article.
References and Additional Reading
NWMLS — Regional real estate listing and sales data. The Snohomish County figures in this article were supplied from NWMLS and ShowingTime using the property filters described above.
ShowingTime — Showing activity and buyer-demand data used by real estate professionals.
Freddie Mac Primary Mortgage Market Survey — Weekly national mortgage-rate averages.
Federal Reserve Bank of St. Louis: 10-Year Treasury Yield — Daily long-term U.S. Treasury yield data.
Federal Reserve: July 29, 2026 FOMC Statement — The latest Federal Reserve policy decision available as of publication.
U.S. Bureau of Labor Statistics: July 2026 Consumer Price Index — Inflation data for consumers, including shelter and energy.
U.S. Bureau of Labor Statistics: August 2026 Employment Situation — National job growth, unemployment, and wage data.
Washington Employment Security Department: Snohomish County Profile — Local employment and unemployment information.
Washington Employment Security Department: King County Profile — Employment context for the county where many Snohomish County residents work.
Washington Employment Security Department: Skagit County Profile — Employment context for the market north of Snohomish County.
Fannie Mae: August 2026 Housing Forecast — National forecasts for home sales, home prices, and mortgage rates.
Fannie Mae: Q3 2026 Home Price Expectations Survey — Consensus national home-price expectations from housing experts.
National Association of REALTORS®: July 2026 Existing-Home Sales — National sales, price, inventory, and affordability trends.
Realtor.com: August 2026 Housing Trends — National inventory, pricing, pending-sales, and price-reduction trends.
National Association of Home Builders: Housing Supply and Construction Costs — Discussion of material costs, regulation, tariffs, and housing supply.
Reuters: Mortgage Rates, Energy Prices, and Geopolitical Risk — Current reporting on the connection between oil prices, bond yields, and mortgage rates.


Comments